Meta Description: Social media ROI is the metric that proves every post, Reel, and ad campaign you run actually contributes to revenue. In 2026, as AI and automation reshape the marketing landscape, leading brands are using tools like ChatbotX to automate the entire measurement cycle – from data collection to executive reporting. This guide delivers 15 battle-tested strategies to turn your social media presence into a reliable, scalable revenue engine.
Launch agentic chat marketing in minutes with ChatbotX
1. What Is Social Media ROI? Definition and Formula for 2026
Social media ROI (Return on Investment) measures the profit generated relative to the total cost invested in all social media activities. According to Sprout Social’s Social Media Index, demonstrating measurable ROI remains the top challenge for social media marketers worldwide – making a structured measurement framework more critical than ever.
Without a clear ROI, leadership only sees activity. With ROI, you present a profit-driving story – and that is the difference between a marketing team that gets more budget and one that gets cut.
The standard social media ROI formula for 2026:
Real-world example: You spend $5,000 on a LinkedIn campaign in a single month, covering content production, staff time, and ad spend. The campaign generates $14,000 in directly attributed revenue.
ROI = [(14,000 – 5,000) / 5,000] × 100 = 180%
What makes this calculation far more powerful in 2026 is the ability to automate the entire measurement cycle – from cross-channel data collection and attribution analysis to report generation – through AI platforms like ChatbotX, replacing hours of manual spreadsheet work every single week.
2. Map Social Media ROI Goals to Business Outcomes
Clarify Business Goals and Assign Channel Roles
Every metric on your dashboard must trace back to a specific business goal. Start by auditing your revenue funnel and assigning a primary role to each social channel:
- Awareness channels (TikTok, YouTube Shorts, Instagram Reels): prioritize Reach, View Duration, and Brand Lift.
- Conversion channels (Facebook Ads, LinkedIn Lead Gen, paid social): focus on Cost per Lead and Conversion Rate.
- Retention channels (Facebook Groups, Discord, community platforms): measure Retention Rate and Customer Lifetime Value.
Build a simple documentation sheet using this structure: Goal → Target % Change → Primary Metric → Execution Channel.
💡 2026 Pro Tip: Use ChatbotX to automatically tag every social conversation to the correct funnel stage, so you know exactly which channel is driving pipeline – without any manual data entry.
3. The Social Media ROI Metrics Matrix
The social media ROI metrics matrix keeps your team from chasing vanity numbers. Fill in each funnel stage and define the metrics that prove real revenue impact. Social Media Examiner’s annual industry report confirms that marketers using a structured funnel-based metrics framework are twice as confident when requesting budget increases from leadership.
| Funnel Stage | Primary Metric | Financial Tie-In | Example KPI Target |
|---|---|---|---|
| Awareness | Reach, Unique Impressions | CPM vs. branded search lift | 40% brand lift increase post-campaign |
| Consideration | Engagement Rate, Content Saves | Lead quality via content-assisted attribution | 5% uplift in qualified leads |
| Conversion | Conversion Rate, Revenue per Session | Direct revenue via UTM-tagged landing pages | \$30,000 in attributed revenue |
| Loyalty | Repeat Purchase Rate, Retention Rate | LTV increase, churn reduction | 12% increase in repeat buyers |
| Advocacy | Referrals, UGC Volume | Net new customers from peer recommendations | 25 UGC submissions per quarter |
⚠️ Important: Track no more than 5 KPIs per channel. Too many metrics dilute focus and make your social media ROI reports lose credibility with leadership. HubSpot’s annual State of Marketing report consistently finds that teams with clearly defined KPIs per channel are 2× more likely to report positive ROI than those without.
4. Convert Soft Metrics Into Hard Dollar Value
Soft metrics become powerful proof when you attach a specific dollar value to them. Survey your CRM, past campaigns, and average deal size to build reliable multipliers. McKinsey’s research on marketing ROI measurement shows that companies using data-driven lead valuation models generate up to 40% more revenue than those relying on intuition alone.
Formula for calculating social lead value:
Value per Lead = Average Deal Value ÷ Number of Leads Required per Deal
Example: 8 social leads → 1 deal worth $3,000
→ Each lead is worth = $3,000 ÷ 8 = $375
Best practices when assigning dollar values to soft metrics:
- Keep valuations conservative to avoid overstating ROI in leadership presentations.
- Run a sensitivity analysis with three scenarios: low – mid – high.
- Present the full range to help decision-makers assess risk versus potential return.
⚠️ Key reminder: Revisit valuations every quarter. Changes in product pricing or customer behavior will shift the true dollar value of each lead.
5. Multi-Touch Attribution in the AI Era of 2026

Multi-touch attribution credits every interaction along the customer journey, not just the final click. In 2026, attribution models are increasingly powered by AI to handle more complex customer paths – especially when a prospect interacts with your brand via chatbot, social post, and email all within the same day.
Comparing the most widely used attribution models in 2026:
| Model | How Credit Is Distributed | Best Used When |
|---|---|---|
| Last Click | 100% to the final touchpoint | Pure performance campaigns |
| First Click | 100% to the first touchpoint | Measuring awareness impact |
| Linear | Equal credit across all touchpoints | Long buying journeys, multi-channel funnels |
| Time Decay | Weights touchpoints closer to conversion more heavily | Short sales cycles |
| Position-Based | 40% first – 20% middle – 40% last | Balanced – most widely adopted |
| AI-Powered | Self-adjusting, learns from real behavioral data | Complex cross-channel customer journeys |
Pair attribution with UTM tags and first-party data to close the measurement loop. Google Analytics 4’s attribution documentation provides a detailed breakdown of how to configure data-driven attribution models for cross-channel campaigns. With ChatbotX, every chatbot conversation across social channels is automatically tagged to the right touchpoint in the customer journey, making your attribution model significantly more accurate over time.
6. Automate Your Social Media ROI Dashboard With ChatbotX
In 2026, automating your ROI dashboard is no longer a competitive advantage – it is the minimum standard for staying competitive. Teams still building reports manually are wasting an average of 6–10 hours every week on work that creates zero strategic value. Salesforce’s State of Marketing report found that high-performing marketing teams are 2.1× more likely to use AI-powered analytics automation than underperforming teams.
ChatbotX solves this by:
- Automatically aggregating data from every social channel into a single source of truth – no more copying and pasting between platforms.
- Classifying and tagging leads by source, funnel stage, and predicted value in real time.
- Generating automated ROI reports on a weekly or monthly schedule, delivered directly to leadership inboxes.
- Triggering smart alerts when anomalies appear: a sudden conversion rate drop, a CPM spike, or a sharp decline in engagement.
- Deploying AI chatbots directly on social channels to capture leads, answer questions, and nurture prospects – all tracked and tied back to revenue.
What your 2026 social media ROI dashboard must display:
- Spend vs. revenue broken down by campaign and channel.
- Cost per lead segmented by funnel stage.
- LTV (Lifetime Value) growth from social-sourced customer cohorts.
- Chatbot performance metrics: conversations initiated, lead conversion rate, attributed revenue.
💡 Pro Tip: Build two dashboard versions – one for your marketing team with full experimental notes and granular data, and one for leadership showing top-line KPIs with clear narrative labels. ChatbotX lets you configure both in minutes.
7. Validate Data Integrity Across All Platforms
Poor data quality will undermine your entire ROI case. Run weekly audits covering three core areas:
- Pixel health – Is the tracking pixel firing correctly on every key page and event?
- UTM tagging consistency – Are all URLs shared through social channels tagged in a consistent, standardized format? Use Google’s Campaign URL Builder to generate error-free UTM parameters across every platform.
- Conversion action duplication – Is the system accidentally double-counting the same conversion across multiple platforms?
Cross-check revenue figures against your finance reports. Reconcile social data with accounting exports to ensure you are not counting tracked conversions twice or missing refunds that would lower your actual ROI.
⚠️ Warning: A misfiring pixel can significantly inflate ROI by counting ghost conversions. Always verify pixel firing in the exact environments your audience uses – including mobile apps and in-app browsers where standard tag behavior often breaks.
8. Investment Accounting and Budget Optimization for Maximum ROI
Capture Every Cost Element
Your total social media investment includes everything spent – not just ad spend. Include all of the following to avoid surprises at review time:
- Paid media spend broken down by platform (Facebook, TikTok, LinkedIn, YouTube, and others).
- Creative production costs: video, photography, copywriting, design, and agency retainers.
- Apportioned staff salaries for social strategists, community managers, and data analysts.
- Technology stack fees: scheduling tools, analytics suites, design software, and AI chatbot platforms.
- Training and upskilling costs to keep the team current with platform changes and emerging strategies.
- Opportunity cost for staff time redirected away from other revenue-generating activities.
✅ Pros and ⚠️ Cons of comprehensive investment accounting:
| Details | |
|---|---|
| ✅Pro | ROI grounded in reality – you confidently defend and justify budget increase requests |
| ✅Pro | Surfaces high-leverage content series that deliver outsized returns relative to cost |
| ⚠️Con | Gathering all cost data is time-consuming, especially across cross-functional teams |
| ⚠️Con | If attribution is incorrect, certain cost items may be incorrectly assigned to campaigns |
9. Reallocate Budgets Based on ROI Velocity
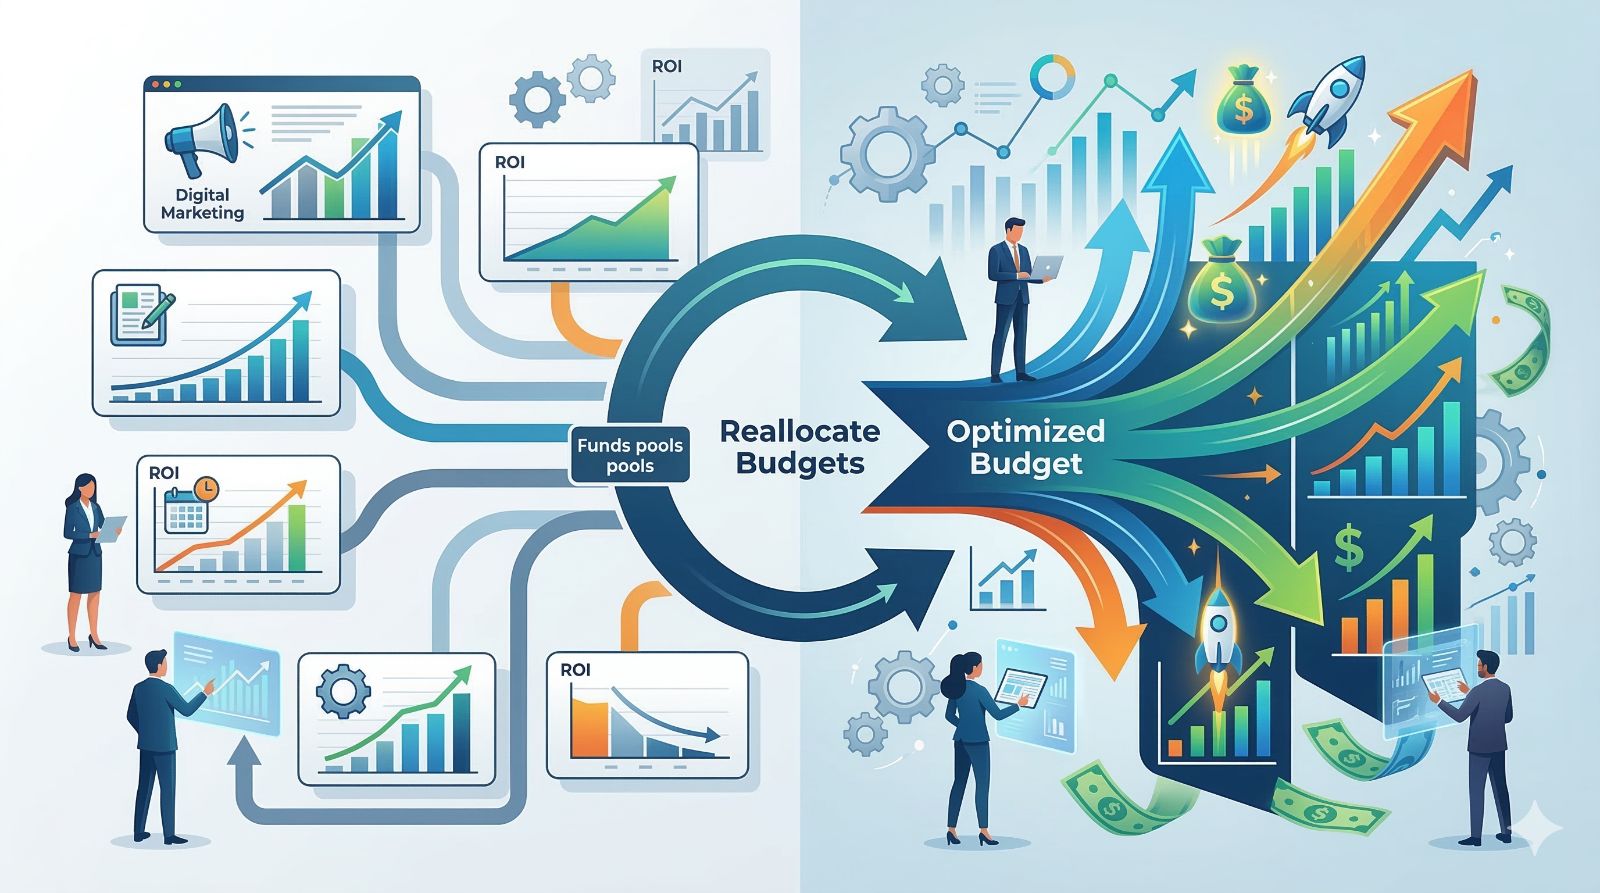
Measure ROI velocity by comparing week-over-week incremental ROI for each active campaign. Use a heat map to surface fast wins (positive velocity) and laggards that need optimization or need to be paused entirely. According to the Nielsen Annual Marketing Report, brands that reallocate budgets dynamically based on performance data achieve 20% higher marketing efficiency than those using fixed quarterly budgets.
| Campaign Type | ROI Speed | Action | Target Reallocation |
|---|---|---|---|
| Product launch paid ads | Fast | Increase daily budget by 20% | Add\$1,500/week in spend |
| Evergreen organic content series | Moderate | Optimize CTA and republish top performers | Add 2 boosted posts per month |
| AI chatbot lead gen (ChatbotX) | Fast | Expand to additional social channels | Deploy on 2 new channels |
| Niche influencer collaboration | Slow | Pause and redeploy budget elsewhere | Redirect\$750 to higher-performing channels |
💡 Automate this reallocation process with ChatbotX so budget shifts happen weekly rather than quarterly – ensuring budget never bleeds into underperforming campaigns for longer than necessary.
10. Design Experiments With a Clear ROI Hypothesis

Every experiment must be anchored to a hypothesis directly tied to ROI. For example: “Adding an AI chatbot to our Facebook Page Messenger will increase comment-to-lead conversion rate by 15%.” Harvard Business Review’s research on A/B testing confirms that companies running structured experiments with documented hypotheses are significantly more likely to scale successful results than those testing intuitively.
Core principles for designing social media ROI experiments in 2026:
- Always include a control group – without a comparison baseline, there is nothing meaningful to learn from the test.
- Document detailed learnings, not just outcomes – a failed experiment still delivers value if you understand exactly why it failed.
- Maintain an experiment backlog ranked by potential revenue impact × ease of execution.
- Prioritize tests that either protect against losses or unlock revenue multipliers at scale.
11. The 5-Step Campaign Testing Framework for Predictable Growth
Apply a disciplined testing cadence to keep social media ROI front and center, even when creative teams demand flexibility:
Step 1 – Baseline Measurement: Record current conversion rates, CTR, and engagement metrics before making any changes to the control.
Step 2 – Hypothesis Design: Document the expected lift, planned test duration, and the exact method for measuring results.
Step 3 – Test Implementation: Run the experiment on 10–30% of your audience to manage risk before committing to a full rollout.
Step 4 – Analysis and Learnings: Compare results against KPI targets, document any variance, and identify the root cause behind the outcome.
Step 5 – Scale or Iterate: Scale winning variants immediately and aggressively. For underperformers, change one variable and retest – do not abandon the concept based on a single result.
12. Social Media ROI Experiment Tracking Table
Document every experiment using this format to build a searchable internal knowledge base – particularly valuable when budgets shift and you need real historical data to defend strategic decisions.
| Experiment | Hypothesis | KPI | Result | Next Step |
|---|---|---|---|---|
| Carousel vs. single image | Carousel boosts link clicks by 12% | CTR | +15%✅ | Scale carousel format across the full funnel |
| Story poll CTA | Poll increases newsletter sign-ups | Conversion rate | -4%❌ | Revise CTA messaging and retest |
| Community reply cadence | Faster replies increase DM leads | Response rate | +22%✅ | Maintain high-cadence reply strategy |
| AI chatbot via ChatbotX on Messenger | Chatbot increases lead conversion by 18% | Lead CR | +24%✅ | Deploy on Instagram DM channel next |
13. Build Executive-Grade Social Media ROI Reports
Translate your metrics into a narrative that leadership understands and cares about: “Social media generated $625,000 in pipeline in Q1, delivering 180% ROI and tripling the number of new accounts compared to the same period last year.”
Recommended structure for an executive social media ROI report:
Page 1: Executive Summary – ROI%, total revenue, total cost, vs. prior period
Page 2: Performance by Channel – color-coded comparison table
Page 3: Top 3 Winning Campaigns + specific, documented reasons why they won
Page 4: Experiment Learnings + a summary of experiments currently running
Page 5: Q+1 Reinvestment Plan + projected ROI forecast with assumptions
Add context by sharing what you learned and how you plan to reinvest results into future campaigns. Leadership values a clear next step just as much as strong results from the current period.
💡 With ChatbotX, you can configure this report to run automatically every week and deliver it directly to leadership inboxes – no more spending Monday mornings manually assembling spreadsheets.
14. Align With Sales and Finance Teams

Partner closely with both sales and finance to confirm that social-sourced leads are converting at the rates you forecasted. Share pipeline worksheets monthly and request structured feedback on lead quality. This alignment prevents the disputes that can undermine your ROI claims during formal reporting cycles. A landmark study published in Harvard Business Review found that companies with tightly aligned sales and marketing functions achieved 20% faster revenue growth and 15% higher profitability than those operating in silos.
Monthly Sales–Finance–Social Alignment Checklist:
- [ ] Reconcile social lead volume against sales CRM records.
- [ ] Confirm actual lead-to-deal conversion rates vs. original forecast.
- [ ] Reconcile attributed social revenue against official finance reports.
- [ ] Update lead dollar values if product pricing or average deal size has changed.
- [ ] Share lead quality insights to improve audience targeting and messaging.
📋 Pro Tip: Finance partners respond well to documented ROI playbooks. Share a concise one-page summary of your formulas, tracked touchpoints, and validation steps – this builds lasting trust and eliminates number disputes at every review cycle.
15. Run Consistent Social Media ROI Performance Reviews

Establish a quarterly review as a non-negotiable team ritual, not an optional exercise. Every review session must address all four pillars:
1. ROI by campaign and channel – Compare against the prior period and against stated targets for the quarter.
2. Investment transparency – Present a full cost summary with no line items omitted or estimated.
3. Experiment learnings and status updates – Which tests concluded this quarter? What was the single most important insight?
4. Next-quarter forecast – Projected spend, expected ROI range, and the top-priority experiments planned.
These structured reviews sustain organizational momentum and ensure social media ROI is treated as a strategic revenue driver across the company – not a discretionary cost to cut when budgets tighten.
Frequently Asked Questions About Social Media ROI in 2026

What is social media ROI and why does it matter in 2026?
Social media ROI is the return on investment generated from all social media activities, measured as a percentage of total costs. In 2026, as marketing budgets face tighter scrutiny and AI automates more processes, measuring ROI has become essential – it is the evidence that proves the value of your social team, secures future budget, and aligns marketing directly with overall business objectives.
How do I prove social media ROI without direct e-commerce conversions?
Track proxy conversions such as ebook downloads, webinar registrations, or chatbot conversation starts. Assign a dollar value to each action based on historical conversion data from your CRM. Use cohort analysis to estimate how many proxy conversions ultimately become paying customers, then multiply by average deal value to arrive at a revenue impact figure. Transparency in your assumptions is critical for leadership to trust the numbers.
What is the best attribution model for social media ROI in 2026?
In 2026, AI-powered attribution is increasingly replacing static traditional models because it learns from real behavioral data and continuously self-adjusts. If you do not yet have sufficient volume for an AI model, start with position-based attribution (40% first touch – 20% middle – 40% last touch) – it balances credit between the touchpoint that created initial awareness and the touchpoint that ultimately drove conversion. Google’s guide to attribution modeling is an excellent starting point for understanding which model fits your funnel. Always validate your model with both sales and finance teams.
How does ChatbotX improve social media ROI?
ChatbotX is an AI chatbot platform that automates the full social media ROI cycle: capturing leads across every channel, classifying and tagging them by funnel stage and predicted value, generating automated ROI reports on a set schedule, and integrating directly with your CRM. Instead of spending 6–10 hours per week on manual data aggregation, your team can focus entirely on strategy and optimization.
How often should I revisit social media ROI benchmarks?
Review benchmarks at minimum quarterly, and immediately after any major campaign, platform algorithm update, or significant market shift. Adjust for seasonality, new platform features, and measurable changes in customer behavior. Keeping benchmarks dynamic prevents outdated expectations from distorting your strategic decisions.
What is a good social media ROI?
Based on 2026 industry benchmarks, an ROI of 100–300% is considered strong performance for most B2B and B2C businesses. Forrester’s research on marketing performance shows that top-performing brands consistently achieve social media ROI above 200% by combining first-party data with rigorous attribution. However, this varies significantly by industry, channel type, and campaign objective. More meaningful than any single data point is the upward trend in ROI over time – and your team’s ability to forecast results accurately quarter after quarter.
Can organic social media be profitable without paid support?
Yes. Organic social can generate meaningful profit when the strategy is built around genuine community, high-value content, and consistent calls to action. Pair your organic strategy with an AI chatbot like ChatbotX to automatically convert organic interactions into leads – without any paid ad spend. Once you identify your highest-performing content formats and messaging, use paid amplification to scale what is already proven to work.
Conclusion: Social Media ROI Is Your Long-Term Competitive Advantage

Social media ROI is not a destination – it is a system of continuous, compounding improvement. In 2026, the brands that lead do not just measure better than their competitors; they act faster because AI handles the heavy lifting of data collection, attribution, and reporting.
Start by mapping each channel to a specific business goal, build an automated dashboard, run disciplined experiments, and report transparently to leadership every quarter. Use ChatbotX to automate the full data collection cycle – from the first lead conversation to the weekly revenue report delivered directly to your executive team.
The teams that master social media ROI measurement do not just win budget approvals more easily – they allocate resources more intelligently, scale winning campaigns faster, and build a social media presence that functions as a genuinely trusted, measurable revenue engine for the entire organization.
Ready to close the loop between social media and revenue? Explore ChatbotX for free →