See what your bots, teams,
and channels are really doing
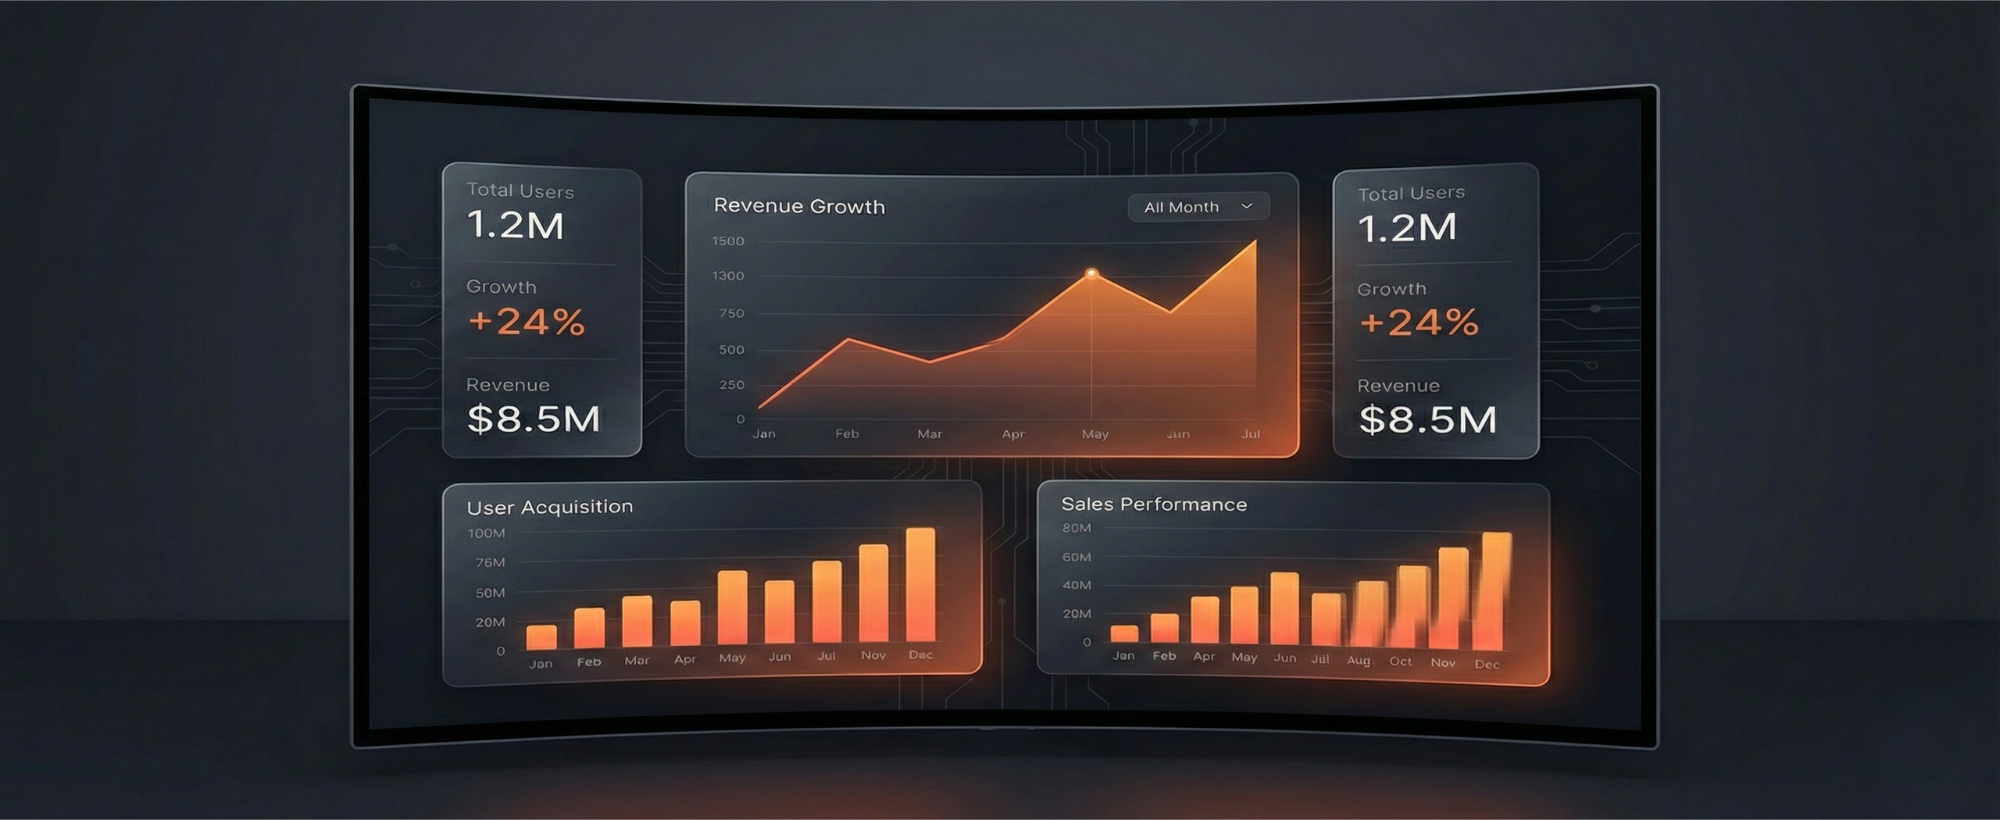
Analytics is the reporting hub for ChatbotX. Track contact growth, response performance, human workload, bot effectiveness, acquisition source, and channel momentum in one place.
Start with the right window
Before reading any number, set the correct date range. Analytics defaults to the last 7 days, but 30 days usually gives a more stable view of the real trend.
Quick ranges
- Today / Yesterday
- Last 7 days / Last 30 days
- This month / Last month
Extended views
- Lifetime history
- Custom date range
- Channel and performance filters
Overview metrics
Five numbers set the baseline before you dive into charts and tables.
Contacts
Total reach
The size of your contact base, with growth compared against the previous period.
New Contacts
Acquisition
How many people were added during the selected range.
Active Contacts
Engagement
How many contacts actually interacted during the period.
Response Time
Speed
Average time from incoming message to reply by bot or human.
First Response Time
First touch
How quickly a new conversation receives its first response.
Contact growth charts
- Total Contacts: The running total of your audience over time. This line should stay flat or move upward.
- New Contacts: Daily acquisition spikes usually reveal which campaigns, links, or broadcasts worked.
- How to read it: Spikes often map to campaigns, steady lifts suggest healthy entry points, and long flat periods mean top-of-funnel needs attention.
Response performance
- Average response time: Compare first response time and overall response time to spot where conversations slow down.
- By humans: Pie charts reveal who carries the load and who may need reassignment support.
- Conversation duration: Long conversations are not always bad. Compare with actual conversion or resolution outcomes.
Humans table
| Column | Meaning |
|---|---|
| Name | The admin or team member handling the conversation. |
| Messages sent | Total messages sent by that person. |
| Contacts | Unique contacts they handled. |
| Response Time | Average reply time across handled conversations. |
| First Response Time | How long they take to send the first reply. |
| Assigned conversations | How many threads are owned by that person. |
Bot performance
- Messages received by the bot: Success versus fallback flow shows whether the bot understands real user intent.
- Messages sent by source: Compare human, bot, and Meta Inbox share to understand how automated the operation really is.
- Handoff volume: Track how often conversations move from bot to human and back again to spot where automation or staffing needs work.
Unique conversations by admins
Use the distribution chart to see how work is divided across the team.
Assigned conversations
Daily assignment trends help explain queue pressure and campaign load.
Follow Up conversations
Monitor leads that still require another touch before they are ready to close.
Archived and blocked
A spike in blocked conversations is a strong signal to review recent messaging frequency or broadcast content.
New contact analysis
- By channel: Compare Telegram, WhatsApp, Instagram, Messenger, and Webchat to see where growth is coming from.
- By source: Separate direct, bot links, inbound ads, and Webchat to identify which acquisition motions deserve more budget.
- By geography: View all contacts and new contacts by country to match content and sending time to the right time zone.
Weekly analytics checklist
- 1. Check contact growth. Review the New Contacts trend against the previous week.
- 2. Review fallback flow rate. If too many messages fall back, feed the missed intent back into keywords or AI training.
- 3. Audit first response time. Slow first-touch response is one of the easiest operational leaks to fix.
- 4. Watch blocked conversations. Sudden increases often mean a campaign is creating fatigue.
- 5. Recheck contact sources. Double down on the entry points that are actually producing net-new contacts.
Frequently
asked
questions
