

Every social media team collects data. Very few actually know what to do with it.
The gap between businesses that scale reliably and those that plateau indefinitely is rarely about budget or content quality. It almost always comes down to one thing: the ability to translate social media data into decisions that move the business forward. That’s what social media analytics reporting actually is – not a monthly ritual of exporting spreadsheets, but a structured system for understanding what your audience is telling you and acting on it before your competitors do.
This guide gives you that system. Whether you’re building your first reporting framework or overhauling one that’s stopped delivering insight, you’ll walk away with a clear methodology, a practical set of metrics, and the tools to make your data work harder.
Launch agentic chat marketing in minutes with ChatbotX














What Social Media Analytics Reporting Actually Means in 2026
For a long time, “social media reporting” meant pulling a reach number at the end of the month and hoping the stakeholders were satisfied. That era is over.

In 2026, with social platforms generating unprecedented volumes of behavioral data, the definition of analytics reporting has fundamentally shifted. It now encompasses three interconnected practices:
Measurement – systematically capturing quantitative signals across every channel your brand touches.
Interpretation – understanding the cause-and-effect relationships behind those signals, not just the numbers themselves.
Decision support – packaging that interpretation into a format that allows specific people (executives, content teams, media buyers) to take specific actions with confidence.
A report that doesn’t change what someone does next has failed, regardless of how polished the charts look.
Why Most Social Media Reports Fail to Drive Growth
The most common failure mode isn’t a lack of data. It’s the wrong data, presented to the wrong audience, at the wrong cadence.
Teams often default to reporting whatever their platform dashboards surface by default – impressions, follower counts, post likes. These numbers feel meaningful because they’re easy to get. But they describe activity, not outcomes. They tell you what happened on the platform, not what happened in your business as a result.
The second failure is treating every stakeholder the same. A report built for a CMO who wants to understand quarterly brand momentum will confuse a content strategist who needs to know whether carousel posts or single images drove more profile visits last week. Effective reporting means segmenting both your audience and your metrics.
A great analytics report isn’t the one with the most charts. It’s the one that makes the right person 20% more confident in their next decision.
The Metrics That Matter — and the Ones That Don’t

Not all metrics deserve your attention equally. The clearest framework for organizing social media metrics is a three-tier model built around the journey from brand exposure to business impact.
Tier 1: Visibility Metrics
These measure how many people your content can potentially reach. They’re necessary context, but they’re never sufficient justification on their own.
Reach measures the number of unique accounts that saw a given piece of content. This is your audience ceiling for any individual post. A consistent upward trend in organic reach signals that your content strategy is resonating with the platform’s distribution algorithm.
Impressions count total content views – including multiple views from the same account. When impressions significantly outpace reach, your existing audience is seeing your content repeatedly, which builds familiarity and brand recall over time.
Share of Voice compares your brand’s presence in relevant conversations against your competitors. This requires a social listening tool, but it gives you competitive context that platform-native analytics simply can’t provide.
Tier 2: Engagement Metrics
Engagement metrics tell you whether the audience you’re reaching actually cares about what you’re saying. This is where you separate reach from resonance.
| Metric | What It Signals | Formula |
|---|---|---|
| Engagement Rate | The percentage of people who saw your content and interacted with it | (Total Interactions ÷ Reach) × 100 |
| Comments per Post | Depth of audience interest; comments require effort | Total Comments ÷ Number of Posts |
| Share Rate | Social endorsement; the highest-trust form of amplification | (Shares ÷ Impressions) × 100 |
| Save Rate | Long-term intent; people saving content for future reference | (Saves ÷ Reach) × 100 |
| Video Completion Rate | How compelling your video content actually is | (Full Views ÷ Total Views) × 100 |
A high engagement rate with low reach tells you that your existing audience loves you but you haven’t cracked distribution yet. High reach with low engagement is the inverse problem: you’re visible, but you’re not connecting.
Tier 3: Conversion Metrics
These are the metrics that close the loop between your social activity and business outcomes. They require proper tracking infrastructure to measure accurately, but they’re the ones that make your work undeniable to leadership.
Click-Through Rate (CTR) shows what percentage of people who saw your content took the next step and clicked through to your destination. Average social CTR varies widely by industry and platform, but any figure above 2% on organic content is generally strong.
Cost Per Click (CPC) and Cost Per Acquisition (CPA) apply specifically to paid social campaigns. These numbers let you compare social investment directly against other channels.
Lead Attribution by Channel tracks how many leads or sales originated from specific social platforms or campaigns. This requires UTM parameter tagging on every outbound link and integration with tools like Google Analytics or your CRM system.
Revenue Attributed to Social is the ultimate conversion metric. It requires a properly configured attribution model and full integration between your social analytics and your sales data, but it’s the only number that definitively proves ROI to a CFO.
How to Structure a Report That Drives Action
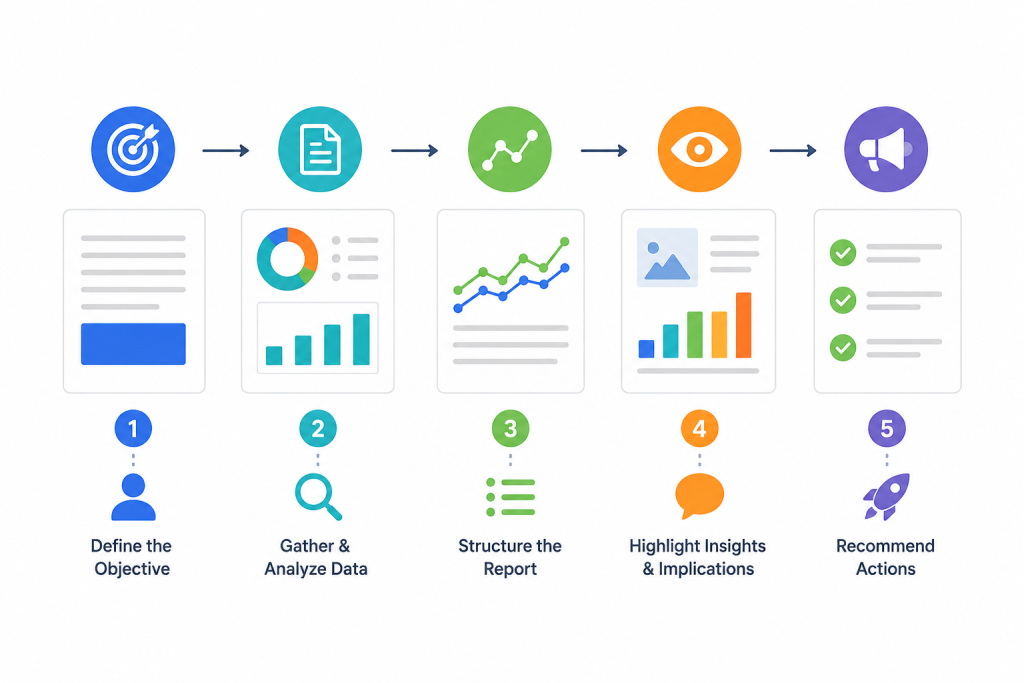
The structure of your report determines whether it gets read – and whether it gets acted on. A well-structured report has a clear spine: context → findings → implications → recommendations.
Step 1: Define the Business Question Before You Touch the Data
Every report should begin with a statement of purpose. What business question is this report designed to answer?
- “Is our Instagram strategy generating measurable website traffic?”
- “Which content format is driving the most leads from LinkedIn this quarter?”
- “Are we growing brand awareness faster than our primary competitor?”
This sounds obvious, but most reports skip this step. The result is a document full of metrics that don’t add up to a conclusion. When you start with a specific question, every element of the report either helps answer it or doesn’t belong.
Step 2: Match Metrics to Audience
Before selecting your KPIs, decide who’s going to read this report and what decisions they need to make.
| Report Audience | Primary Decisions | Key Metrics |
|---|---|---|
| C-Suite / Board | Strategic investment, channel budget | Revenue attributed, CAC, brand SOV, channel ROI |
| Marketing Director | Campaign strategy, content mix | Engagement trends, conversion rates, funnel movement |
| Content Team | Post frequency, format, topics | Top-performing posts, format breakdown, engagement by type |
| Paid Social Manager | Bid strategy, creative rotation | CPC, CPM, ROAS, frequency, CTR by creative |
| Community Manager | Response strategy, tone, timing | Comment volume, sentiment, response time, DM trends |
Building separate summary views for different audiences isn’t duplication – it’s the difference between a report that drives action and one that gets filed away.
Step 3: Establish a Benchmark Before Presenting Any Numbers
Numbers without context are noise. Every metric you report needs a reference point:
- Historical benchmark: How does this compare to the same period last month or last year?
- Goal benchmark: How does this compare to the target you set at the start of the period?
- Competitive benchmark: How does this compare to your industry average or a specific competitor?
Without at least one of these, you can’t tell whether a 4.2% engagement rate is cause for celebration or concern.
Step 4: Lead With Insight, Not Data
Most reports bury the lead. They open with a data table and expect the reader to draw conclusions. Flip this structure. Open with your most important insight in plain language, then use data to support it.
Weak opening: “This month, our reach was 240,000, impressions were 1.2M, and engagement rate was 3.8%.”
Strong opening: “Our short-form video content is significantly outperforming static posts – video generates 2.4x higher engagement and 68% more profile visits, suggesting we should reweight our content calendar toward this format.”
The strong version tells a story. It gives someone reading under time pressure exactly what they need in the first sentence.
Step 5: Close Every Report With Concrete Next Steps
The final section of any effective analytics report is not a summary of the data – it’s a decision list. Specifically:
- What should we start doing based on what we learned?
- What should we stop doing because the data doesn’t support it?
- What should we test to answer the questions this report raised?
This discipline turns reporting from a backward-looking activity into a forward-looking planning tool.
Choosing the Right Reporting Tools

Your tooling determines the ceiling of what you can measure. Here’s a practical framework for evaluating your options.
Native Platform Analytics
Every major platform provides free built-in analytics. Facebook/Meta Business Suite, Instagram Insights, LinkedIn Analytics, TikTok Analytics, and X Analytics give you solid baseline data on your content’s performance within that specific platform.
Best for: Teams managing one or two channels with limited budget, or anyone needing a quick performance check on a specific post or campaign.
Limitation: Native tools are siloed by design. They can’t show you cross-channel performance, attribute conversions across touchpoints, or compare your metrics against competitors.
Third-Party Social Analytics Platforms
Dedicated analytics platforms like Sprout Social and others in the space aggregate your data across platforms and add competitive intelligence, sentiment analysis, and automated reporting capabilities.
Best for: Multi-channel teams, agencies managing several client accounts, or any organization where cross-channel performance comparison is a regular reporting requirement.
Key features to look for in 2026:
- Unified cross-channel dashboards
- Automated report scheduling and delivery
- Historical data retention beyond what native tools provide
- Competitor benchmarking
- AI-powered insight surfacing
AI-Augmented Analytics
The fastest-growing segment of the analytics market is tools that don’t just collect and display data, but actively interpret it. Rather than showing you that engagement dropped 12%, these systems identify the likely cause (posting time change, content format shift, algorithm update) and suggest corrective actions.
According to Statista’s Digital Advertising Outlook, marketing teams globally are rapidly increasing investment in AI-driven analytics infrastructure, with AI-augmented analytics becoming a standard rather than a premium feature for enterprise teams.
Comparison: Tool Types at a Glance
| Criteria | Native Analytics | Third-Party Platforms | AI-Augmented Tools |
|---|---|---|---|
| Cost | Free | $99–$999+/month | Varies (often usage-based) |
| Cross-Channel View | No | Yes | Yes |
| Competitor Data | No | Yes (select tools) | Yes |
| Automation | Limited | Strong | Strong |
| Insight Generation | Manual | Partial | Automated |
| Best For | Startups, simple setups | Agencies, mid-market teams | Scaling brands, data-driven teams |
Advanced Reporting: Connecting Social to Revenue
Proving that social media drives revenue is the challenge every social media marketer eventually faces. Here’s the infrastructure you need to make that case convincingly.
UTM Parameter Architecture
Every link you share on social media should carry a UTM tag that identifies the source, medium, campaign, content, and term. This creates a data trail from your social post to your analytics platform, letting you attribute traffic and conversions with precision.
A clean UTM architecture looks like this:
utm_source=instagram
utm_medium=organic_social
utm_campaign=summer-launch-2026
utm_content=carousel-post-day3
Be consistent with naming conventions. Inconsistent UTM tags create fragmented data that’s nearly impossible to analyze at scale.
Multi-Touch Attribution Models
The customer journey rarely runs in a straight line. A buyer might discover your brand through an Instagram Reel, engage with three Facebook posts over two weeks, click a LinkedIn ad, and then convert via an email – all before making a purchase.
Which channel gets credit for that sale?
Last-touch attribution gives 100% of the credit to the final touchpoint before conversion. This systematically undervalues top-of-funnel channels like organic social.
First-touch attribution gives all credit to the initial discovery point. This overvalues awareness channels and ignores the role of nurturing content.
Linear attribution distributes credit equally across every touchpoint. It’s more balanced but still imprecise.
Data-driven attribution, now accessible via Google Analytics 4, uses machine learning to assign credit based on the actual statistical impact each touchpoint had on conversion. This is the most accurate model for most businesses and should be your default in 2026.
Calculating Social Media ROI
Once your attribution data is in place, social ROI calculation is straightforward:
Social ROI = (Revenue Attributed to Social − Social Media Investment) ÷ Social Media Investment × 100
“Social Media Investment” should include platform ad spend, tools and software costs, and a realistic estimate of team time (hours × loaded hourly rate).
Document this calculation methodology in your reports so stakeholders trust the number. An unexplained ROI figure is far less credible than one with a clear methodology attached.
How ChatbotX Transforms Your Analytics Workflow
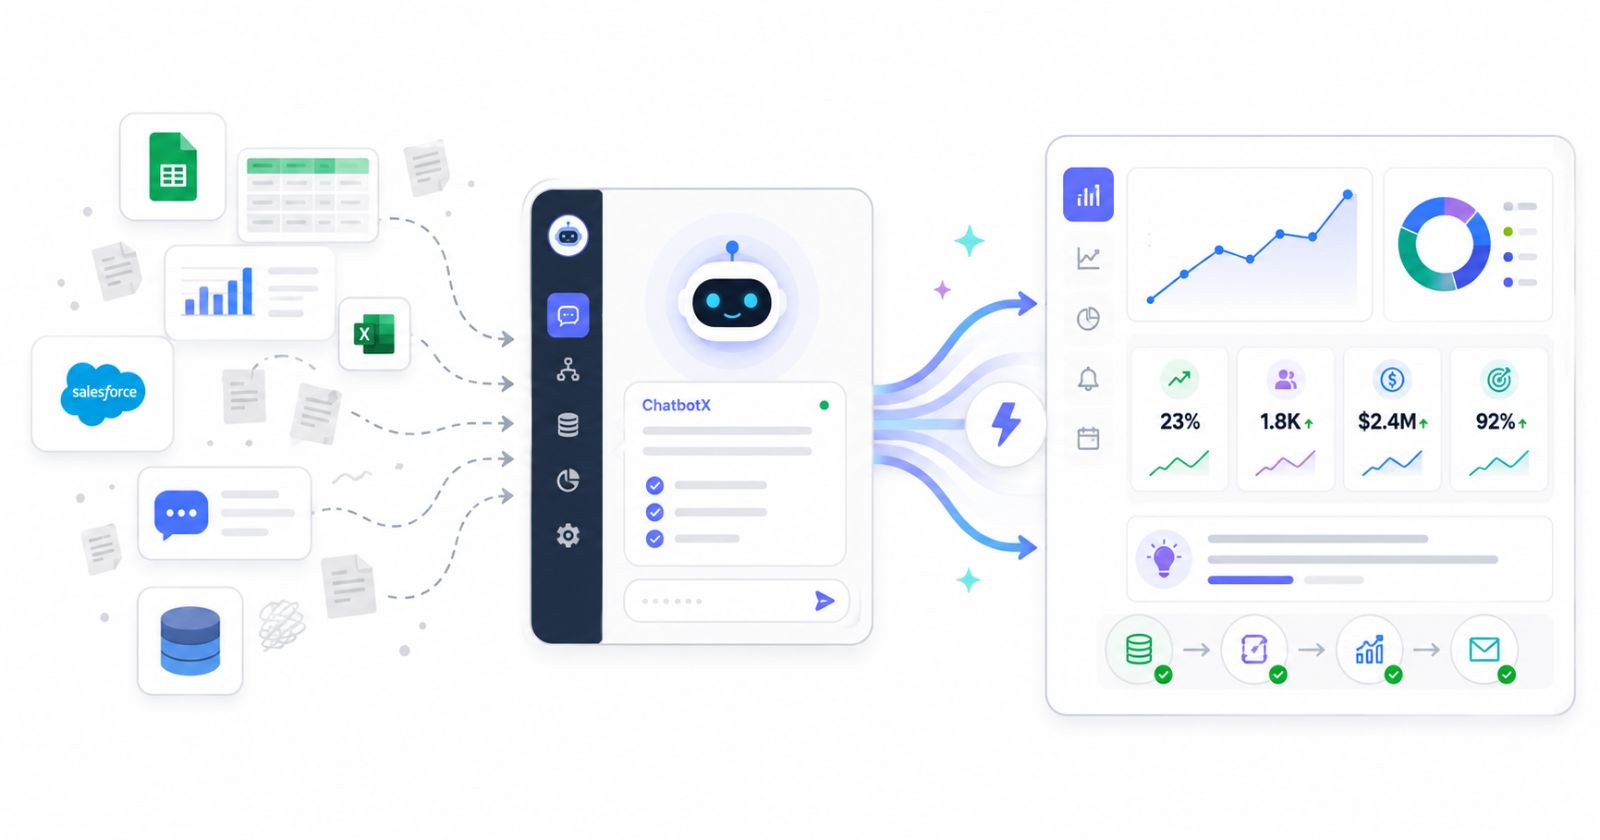
Most analytics challenges aren’t data problems – they’re workflow problems. You have the numbers, but they’re scattered across six different platforms, manually compiled into a spreadsheet every Monday morning, and available only to the person who built the spreadsheet.
This is where ChatbotX fundamentally changes the equation.
ChatbotX is an open-source, agentic omnichannel platform built for teams that manage customer conversations at scale across WhatsApp, Instagram, Messenger, Telegram, Zalo, and more. But beyond conversation management, ChatbotX surfaces the analytics that turn those conversations into strategic intelligence.
Unified Analytics Across Every Channel
Rather than context-switching between platform dashboards, ChatbotX’s Analytics feature consolidates your performance data into a single view. You can track response rates, conversation volumes, resolution times, engagement patterns, and conversion events across every channel you operate – without exporting a single spreadsheet.
This cross-channel visibility reveals patterns that siloed platform analytics will never show you. When your WhatsApp response time drops below 5 minutes, does your Instagram conversion rate improve? ChatbotX’s unified dashboard gives you the data to find out.
Shared Inbox with Conversation Intelligence
One of the most underutilized sources of social media insight is the conversations themselves. Your DMs, comments, and chat threads contain direct signals about what your audience wants, what objections they have, and what language resonates with them.
ChatbotX’s Shared Inbox brings every customer conversation into one collaborative workspace, so your entire team works from the same data. Conversation trends become visible at scale – instead of individual agents seeing one inquiry at a time, your analytics layer surfaces aggregate patterns: the questions asked most often, the topics generating the highest engagement, the customer segments with the fastest response-to-purchase cycles.
AI Agents That Generate Insight Automatically
The next frontier in social analytics isn’t better dashboards – it’s AI that watches your data continuously and alerts you to what matters before you think to ask.
ChatbotX’s AI Agents can be configured to monitor conversation trends, flag unusual spikes in inquiry volume (often a leading indicator of a content piece going viral or a customer service issue escalating), and trigger automated workflows based on behavioral signals. This transforms analytics from a periodic reporting exercise into a continuous intelligence system.
For teams who want to understand how to beat the algorithm with data, see the ChatbotX blog’s deep dive on how social media algorithms really work in 2026 – a practical guide to turning algorithmic data into content strategy.
Open Source Transparency and Extensibility
Unlike closed-source analytics platforms, ChatbotX is built on an open-source foundation. You can inspect the code, customize the data models, and integrate ChatbotX analytics with your existing data stack – BI tools, CRMs, data warehouses – without depending on proprietary APIs.
The ChatbotX GitHub repository is the starting point for teams who want to self-host or extend the platform’s analytics capabilities. With an active contributor community and transparent release cycle, you can track exactly what’s changing and why – the kind of trustworthiness that closed analytics tools simply can’t offer.
For those ready to go deeper, browse the ChatbotX GitHub releases to see what’s shipped recently, including new analytics modules and channel integrations.
Best Practices for Consistent, High-Impact Reports
Great reporting is a habit, not an event. These practices separate teams that report consistently and improve continuously from those that produce one-off decks.
Set a Non-Negotiable Reporting Cadence
Choose a frequency for each report type and protect it on the calendar. A good default structure:
- Weekly pulse (15 minutes): Key engagement and response metrics, active campaign performance, any anomalies flagged for immediate attention.
- Monthly performance review (1–2 hours): Full KPI review against goals, content performance breakdown, audience growth trends, actionable recommendations for the coming month.
- Quarterly strategic review (half day): Channel-level ROI, year-over-year trends, competitive positioning, budget allocation recommendations for the next quarter.
Consistency is what builds the historical dataset that makes your insights credible. A single month’s data is a data point. Twelve months of consistent reporting is a trend line you can predict from.
Build Templates, Not One-Off Reports
Every hour spent reformatting a report from scratch is an hour not spent analyzing it. Build a standard template for each report type and lock in the format. Standardized templates also make it easier to spot changes – when the structure stays consistent, the numbers stand out.
For teams managing multiple social channels and customer conversations simultaneously, the ChatbotX blog’s guide on LinkedIn social media management in 2026 offers practical frameworks for structuring multi-channel performance reviews that translate well across platforms.
Contextualize Every Number
A metric presented without context is an invitation to misinterpretation. For every key figure in your report:
- State the number clearly.
- Compare it to the benchmark (last period, goal, or industry average).
- Explain the likely cause of any significant change.
- Recommend a specific action.
This four-step commentary discipline makes your reports significantly more actionable and demonstrates the analytical depth that earns trust with leadership.
Automate Data Collection, Not Insight Generation
Automation is valuable for the mechanical parts of reporting: pulling data from multiple sources, populating a dashboard, triggering scheduled report delivery. But the interpretation layer – understanding why a metric moved and what to do about it – still requires human judgment.
Use automation to eliminate the time-consuming manual work of data collection. Use that recovered time to go deeper on interpretation. The combination of automated data pipelines and expert human analysis is what produces reports that genuinely change strategy.
Frequently Asked Questions
How often should I produce social media analytics reports?
The right frequency depends on what decisions the report informs. Campaign-level tactical reports benefit from weekly cadence. Strategic performance reviews align better with monthly or quarterly cycles. The key principle: match your reporting frequency to your decision-making frequency. If a decision gets made weekly, the data supporting it needs to be weekly.
What is the difference between social media analytics and social media reporting?
Analytics is the process of examining data to identify patterns, test hypotheses, and answer questions. It’s investigative work. Reporting is the process of communicating what you found – packaging the outputs of your analysis into a format that enables specific people to make specific decisions. Analytics produces insight; reporting distributes it.
Which social media metrics should I prioritize in 2026?
Prioritize metrics that have a traceable connection to business outcomes: conversion rate, revenue attribution, cost per acquisition, and audience growth quality (not just follower count). Secondarily, track engagement metrics that predict downstream conversions – save rate and share rate tend to be stronger leading indicators than likes. Deprioritize pure vanity metrics like raw impression counts unless paired with a cost-efficiency metric.
How do I measure social media ROI?
Use the formula: (Revenue Attributed to Social − Total Social Media Investment) ÷ Total Social Media Investment × 100. The key prerequisites are: UTM-tagged links on every social post, a properly configured attribution model in your analytics platform, and a clear definition of what counts as a conversion. Start with last-touch attribution if you’re new to this, and graduate to data-driven attribution as your data volume grows.
What’s the biggest mistake teams make in social media reporting?
Reporting on what’s easy to measure rather than what matters. It’s tempting to lead with impressive-looking reach and impressions numbers because they’re always available. But these metrics answer the question “how visible were we?” – not “how much did this contribute to the business?” Build your reports from business outcomes backward, not from platform data outward.
Can AI help with social media analytics reporting?
Increasingly, yes. AI-powered tools can surface anomalies in your data faster than manual review, generate natural-language summaries of metric changes, and suggest A/B tests based on historical patterns. Platforms like ChatbotX integrate AI agent capabilities directly into their analytics workflows, enabling continuous monitoring and automated alerting rather than once-a-month manual reporting.
Start Building a Reporting System That Actually Drives Growth
Most social media teams are sitting on more data than they know what to do with. The problem isn’t access to information – it’s the infrastructure to turn that information into decisions, consistently, at speed.
If you’re ready to close the gap between data and action, ChatbotX gives you the platform to do it. From a unified analytics dashboard that consolidates every channel into a single view, to AI agents that monitor your conversations and surface insight automatically, to an open-source foundation that integrates with your existing stack – ChatbotX is built for teams that take analytics seriously.
Here’s how to get started:
- Explore the platform: Visit chatbotx.io to see the full feature set, including analytics, shared inbox, flow builder, and AI agents.
- Dive into the code: The ChatbotX GitHub repository gives you full transparency into the platform’s architecture, with a self-hosting option for teams that need data sovereignty.
- Try it today: ChatbotX is open-source and free to get started. Connect your first channels, set up your analytics dashboard, and start building the reporting system your team actually deserves.
The brands that win in 2026 are not the ones with the biggest follower counts. They’re the ones who understand their data better – and act on it faster. Your reporting system is the foundation of that advantage.


