

- Facebook Comment Automation: Automate responses across Fanpage posts, ads, and Reels.
- Instagram Comment Automation: Automate replies across Instagram Business posts and Reels.
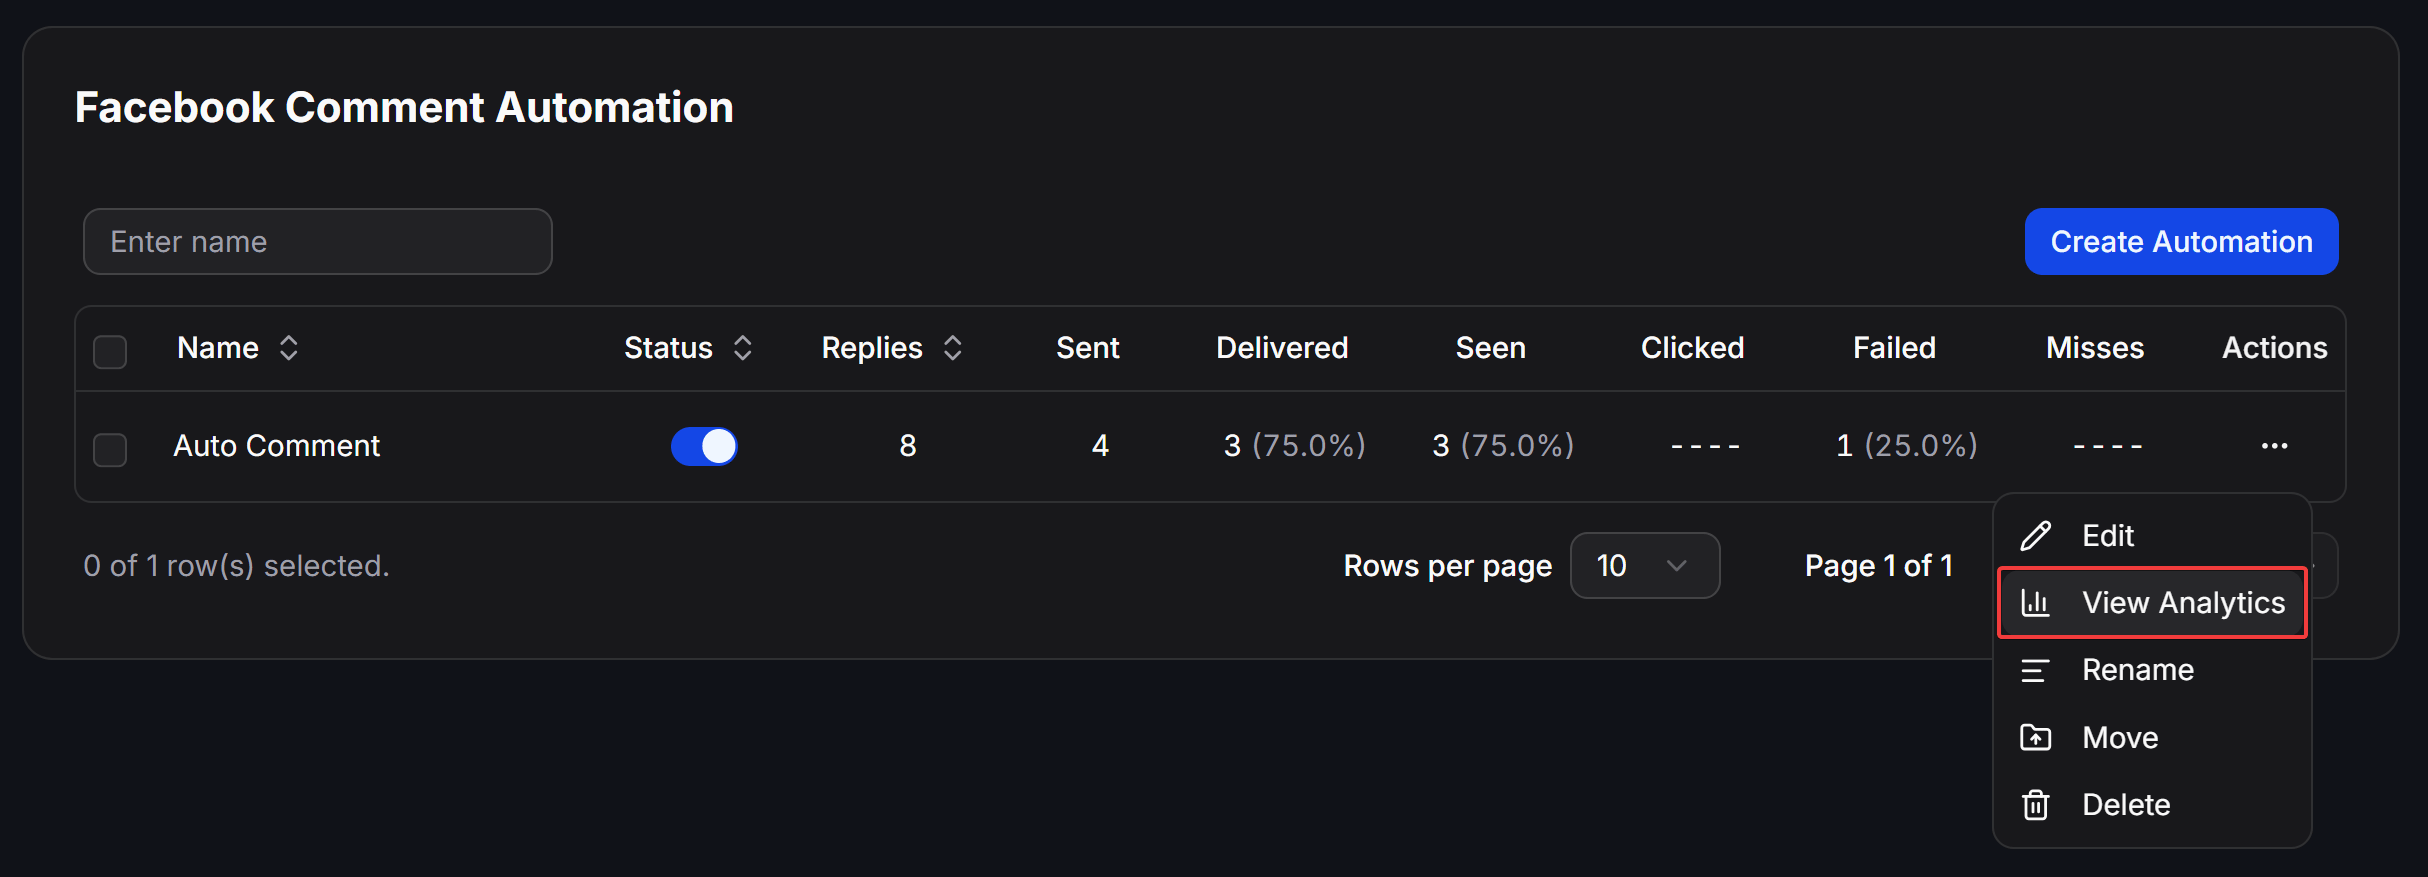
How to Access the Analytics Dashboard
You can access the dedicated analytics screen for any individual campaign by following these steps:1
Navigate to the comment automation tool
From the left sidebar of your portal, click Tools, then select Facebook Comment Automation or Instagram Comment Automation depending on the channel you are monitoring.
2
Locate your campaign
In the campaign data table, find the specific automation row you want to inspect.
3
Open analytics
Click the three dots
... in the Actions column on the far right of the row, then select View Analytics. You will be directed immediately to the campaign’s comprehensive reporting page.Core Metrics on the Campaign Table
Directly within the campaign management table, ChatbotX displays high-level funnel metrics so you can review real-time performance at a glance:Reply Volume Trends Over Time
The Replies to comments section features a visual trend chart plotting the volume of public replies executed each day over your selected date range.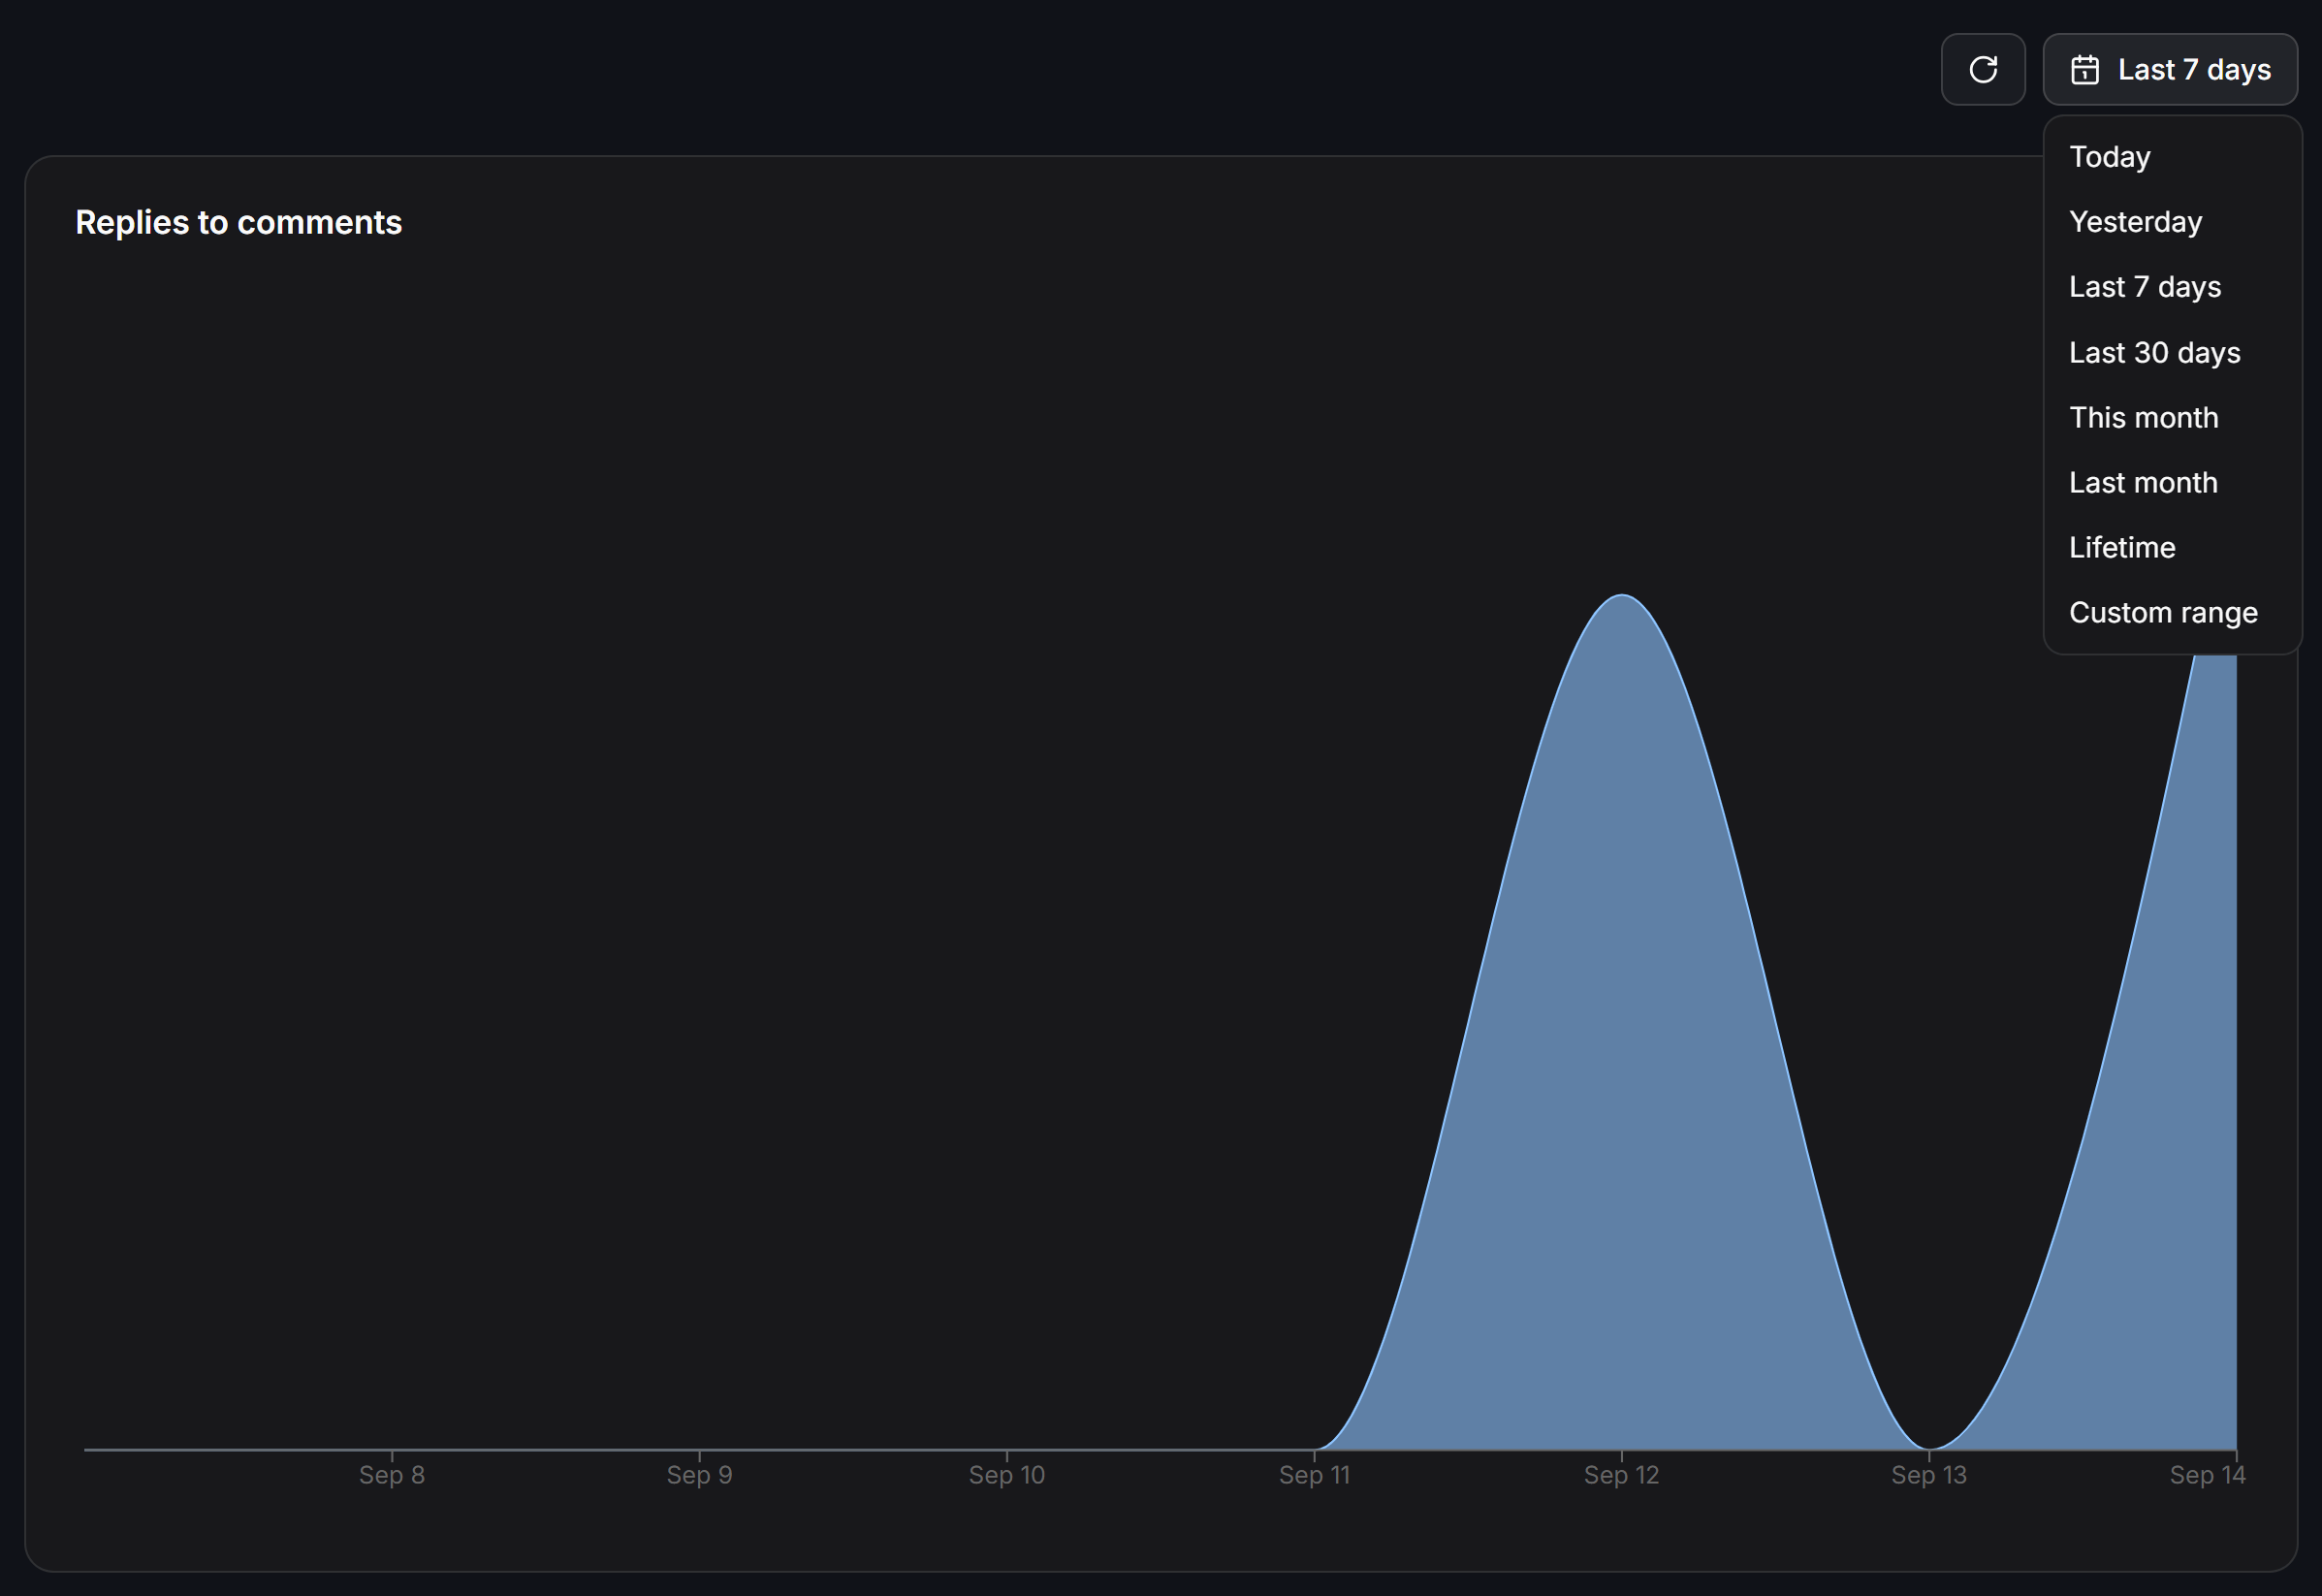
Date Range Selector and Refresh Button
The upper-right corner of the chart contains quick controls:- Refresh button (↻): Click to fetch real-time updates immediately without reloading the entire page.
- Date Range dropdown: Select predefined or customized intervals:
- Today: Activity recorded so far today.
- Yesterday: Full-day metrics from the previous day.
- Last 7 days: Aggregate performance over the past 7 days (default).
- Last 30 days: Long-term trend over the previous month.
- This month: Month-to-date activity.
- Last month: Complete previous calendar month.
- Lifetime: Entire campaign history since creation.
- Custom range: Select custom start and end dates tailored to your reporting cycle.
Interpreting the Trend Chart
The smooth area chart helps you:- Correlate engagement spikes with marketing initiatives, post publishing dates, or active ad campaigns.
- Identify abrupt drops in engagement that may point to stalled ads, expired tokens, or fatigue with post creatives.
Daily Breakdown Table
The Replies by date table provides an itemized log of successful reply counts per day: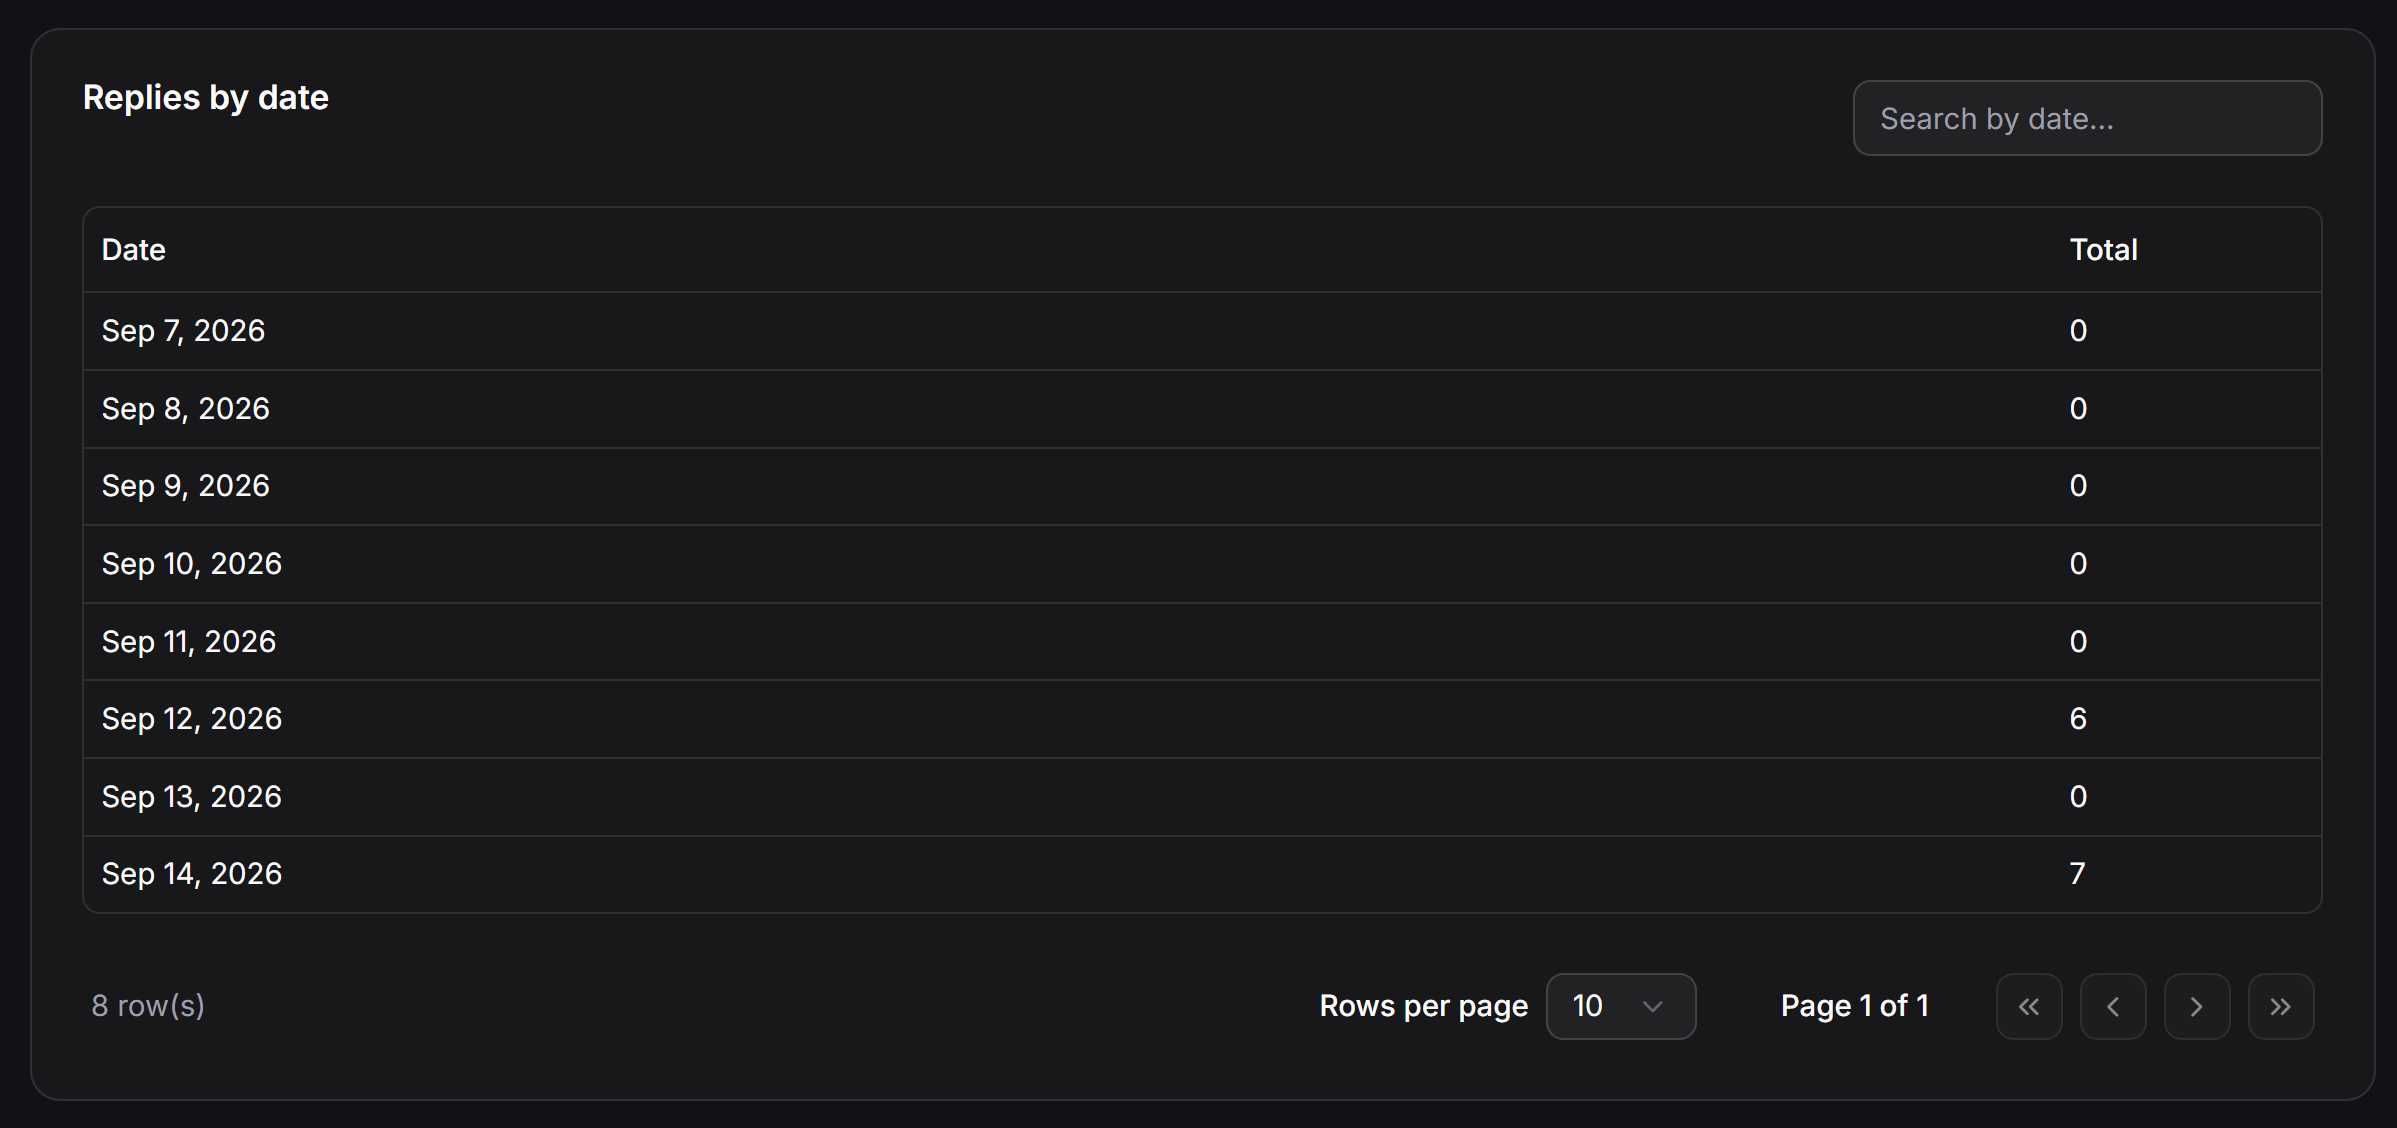
- Date: The exact calendar day (formatted as Month Day, Year).
- Total: Total public comment replies executed on that date.
- Search by date…: Fast search field to locate data for a specific day without scrolling.
- Pagination controls: Switch between 10, 20, or more rows per page with page jump buttons.
User Comments Breakdown
The User comments on this post table aggregates the actual phrases and text strings left by users in the comment section: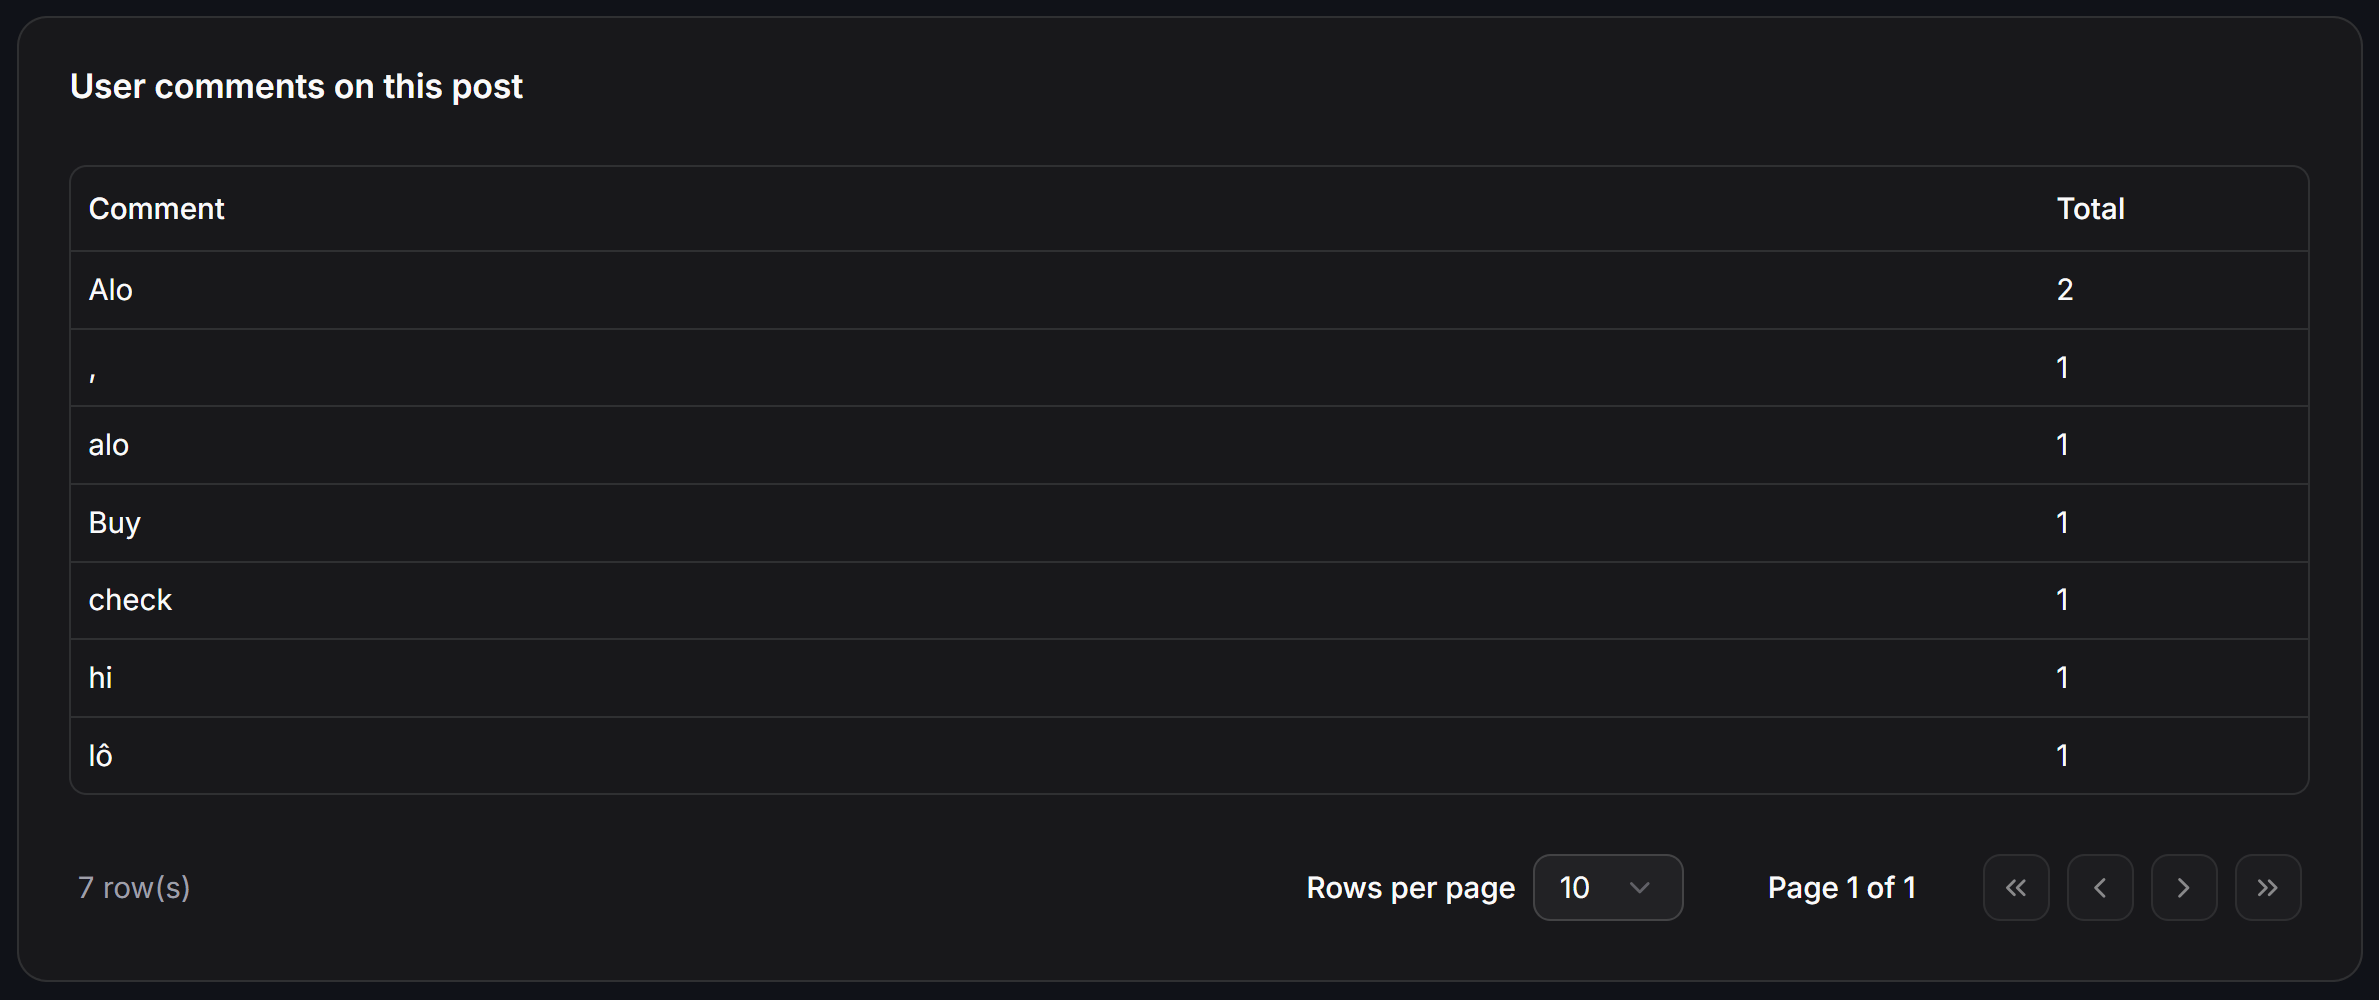
- Comment: The exact comment content submitted by customers on the post.
- Total: Total frequency count of that specific comment over the post’s active lifetime.
Bot Reply Distribution
The Bot replies to comments table highlights which public reply variations the automation published: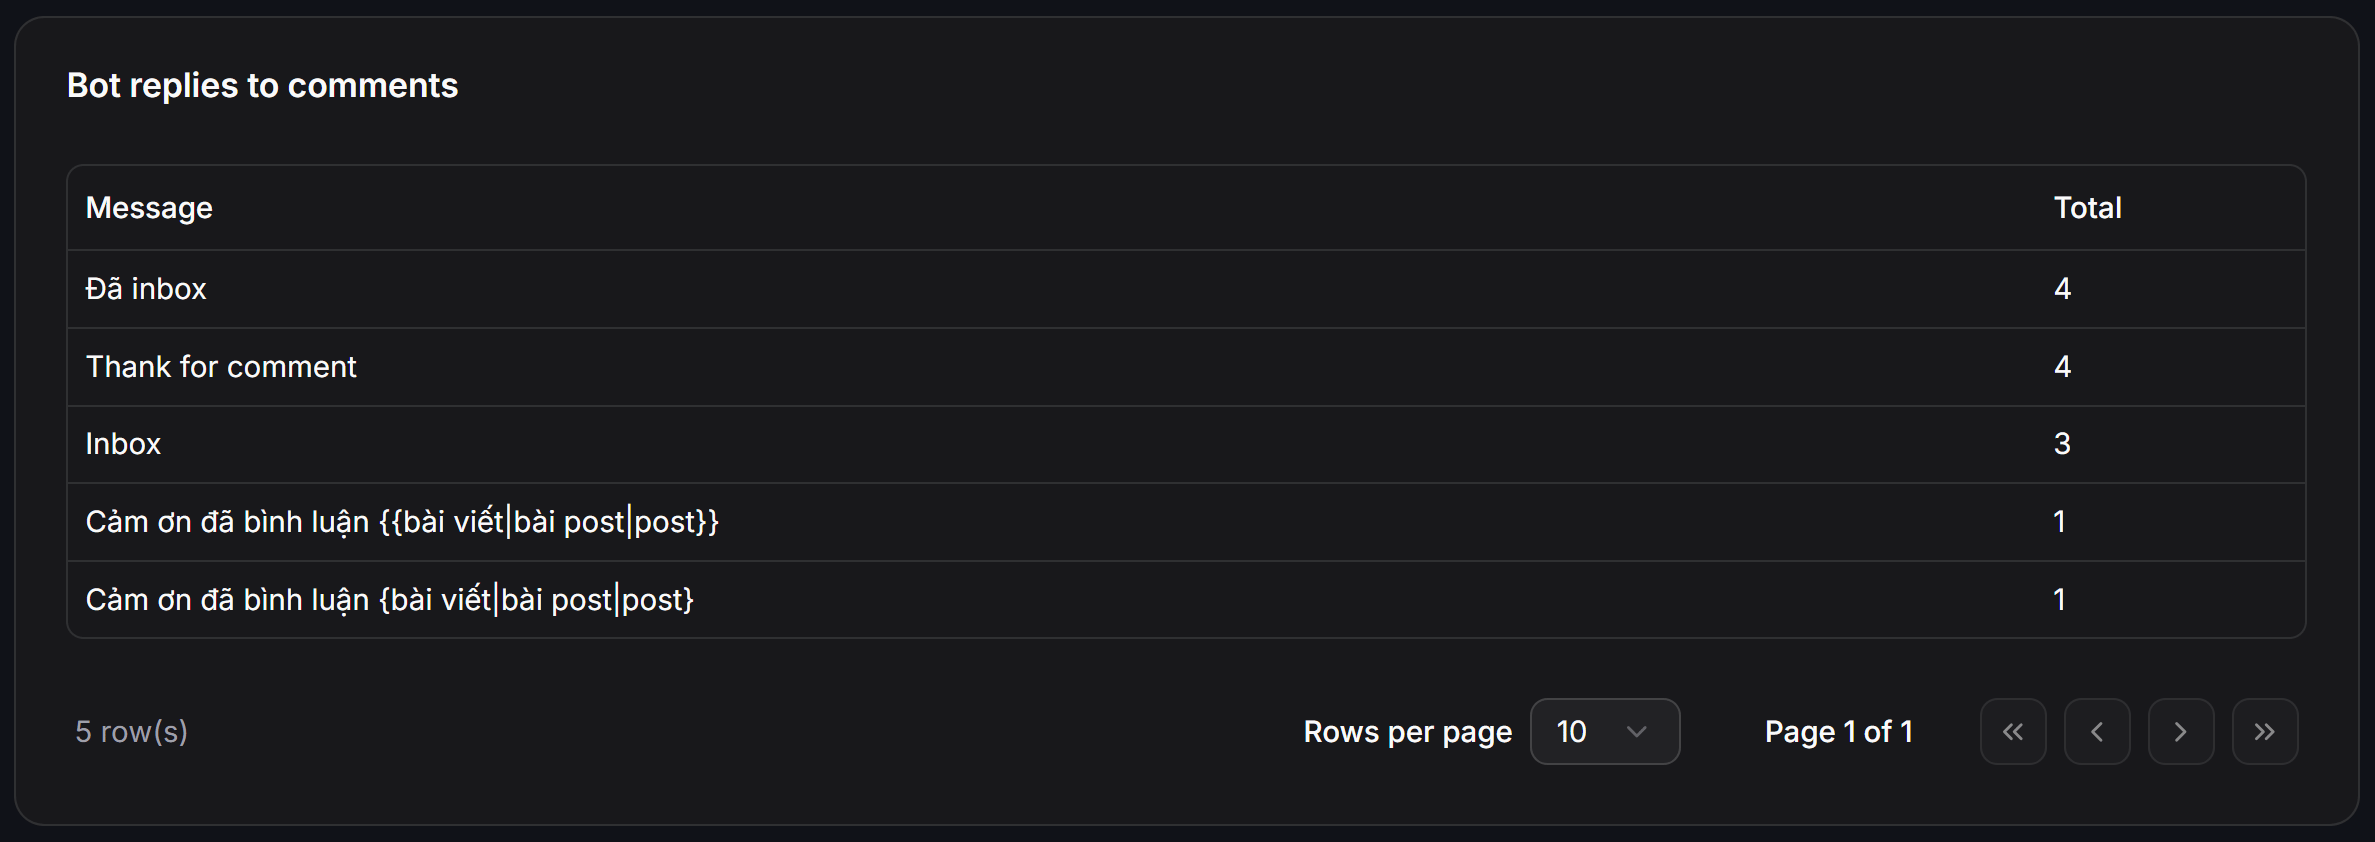
- Message: The public reply text posted by the bot.
- Total: Number of times that specific message was dispatched.
- Spintax Validation: When utilizing random word rotation with spintax syntax like
{bài viết|bài post|post}or{Hi|Hello|Hey}, this table confirms that variants are evenly rotated. This natural variance prevents Facebook and Instagram algorithms from flagging your account for repetitive spam behavior.
Error Logs and Troubleshooting
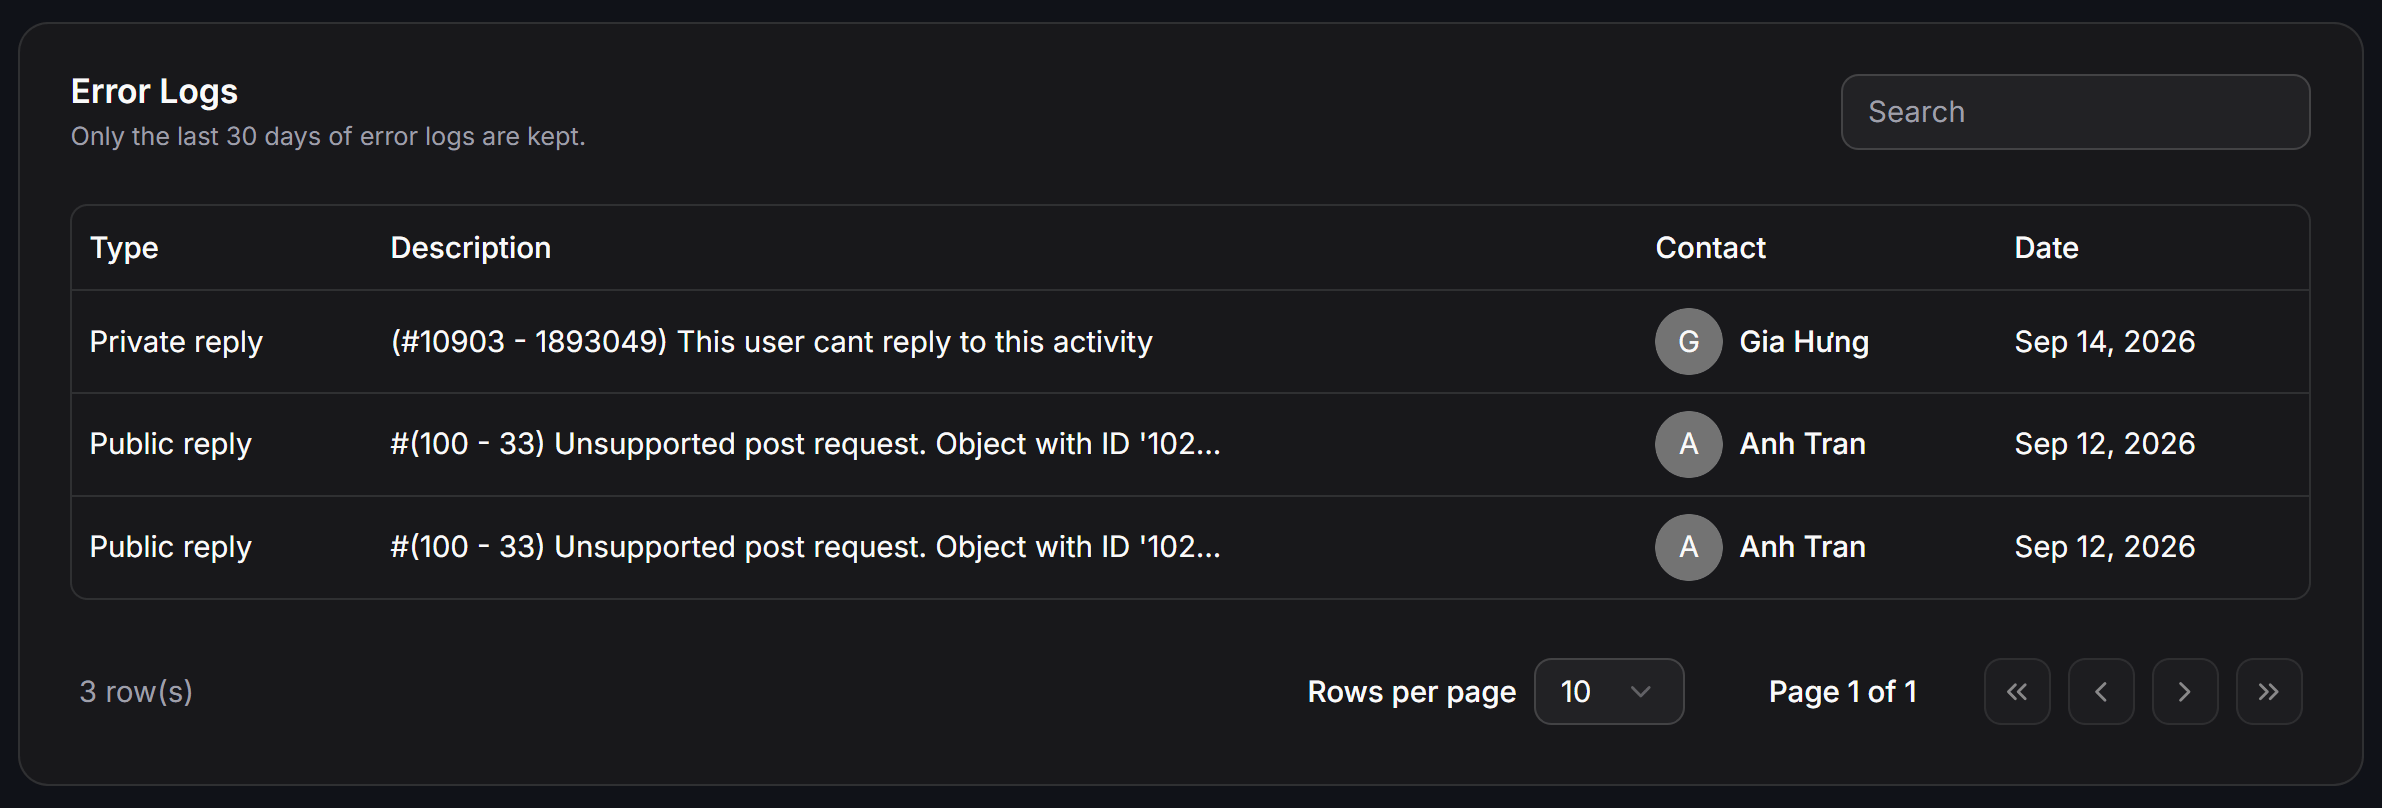
The Error Logs table captures all technical failures preventing the bot from delivering a public reply or private inbox message.ChatbotX retains error logs for the last 30 days (Only the last 30 days of error logs are kept). Historical entries older than 30 days are automatically purged.
Error Log Data Structure
- Type: The specific action that failed:
Private reply: Failure when attempting to send an automated inbox message.Public reply: Failure when attempting to publish a public comment under the user’s remark.
- Description: Raw Meta Graph API error code and descriptive payload.
- Contact: The contact name and avatar icon associated with the failed action.
- Date: Precise timestamp of the event.
- Search bar: Real-time filter to quickly find entries by contact name or specific error keywords.
Common Meta Errors and Solutions
The table below summarizes the most common Meta Graph API error codes logged in Error Logs, their technical root causes, and recommended solutions:Best Practices for Maximizing Conversion
- Benchmark Delivered vs. Seen: If your
Deliveredrate is healthy butSeenis low, test punchier first-line messaging that stands out in lock-screen push notifications. - Monitor the Clicked Rate: If contacts view messages but do not click buttons, simplify your message copy, remove clutter, and feature a single prominent call-to-action (CTA).
- Continuous Keyword Tuning: Regularly review the User comments table to add trending inquiry keywords into your matching rules.
- Audit Error Logs Weekly: Frequent
Public replyerrors bearing code#(100 - 33)signal that page access tokens need refreshing in your channel settings.